Understanding & Deploying Loki: A Practical Guide
Table of Contents
- Motivation
- Introduction
- When to Use Loki
- Architecture Overview
- Components Deep Dive
- Deployment Modes
- Label Design Best Practices
- Deploying to Kubernetes
- Monitoring Loki
- Troubleshooting
- Useful LogQL Queries
Motivation
As systems grow, log volumes become massive. Many logging systems maintain speed by creating full-text indexes of log content, but these indexes require substantial storage and compute resources, causing costs to scale rapidly with log volume.
Loki takes a different approach inspired by Prometheus: it indexes only metadata (labels and timestamps), not the log content itself. This dramatically reduces storage and compute costs while still enabling powerful filtering and searching capabilities. Instead of asking “find all logs containing word X,” you ask “show me logs from service Y in environment Z,” which is how most operational queries work in practice.
Introduction
Loki is a horizontally scalable, multi-tenant log aggregation system designed for cloud-native environments. It collects logs from various sources (applications, servers, Kubernetes workloads) and provides a familiar query language (LogQL) similar to PromQL for log exploration.
Key characteristics:
- Indexes labels and timestamps only, not log content
- Stores log data compressed in chunks
- Scales horizontally by adding nodes
- Integrates seamlessly with Grafana
- Supports multiple storage backends (S3, GCS, Azure Blob)
Architecture Overview
High-Level Architecture
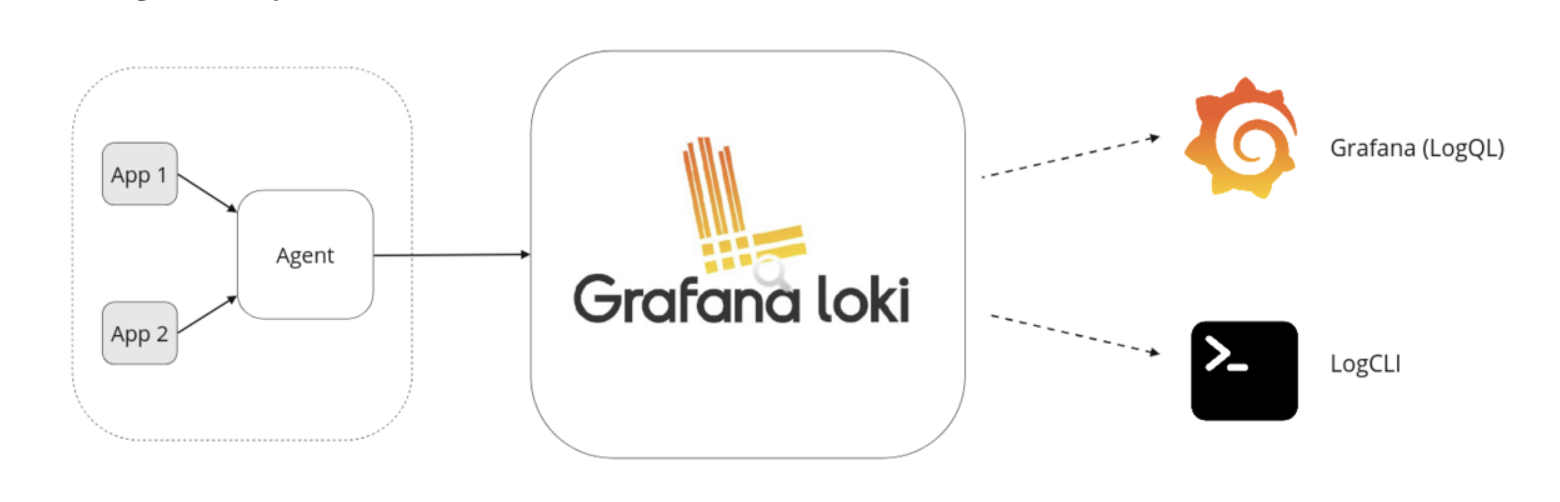
Agents collect and push logs to Loki. Loki processes, indexes, and stores the logs in object storage. Users query logs through a frontend like Grafana.
The agent (such as Promtail) is responsible for pushing logs to Loki. Loki processes and stores the logs. The logs can then be queried through a frontend (e.g., Grafana).
Data Flow Architecture
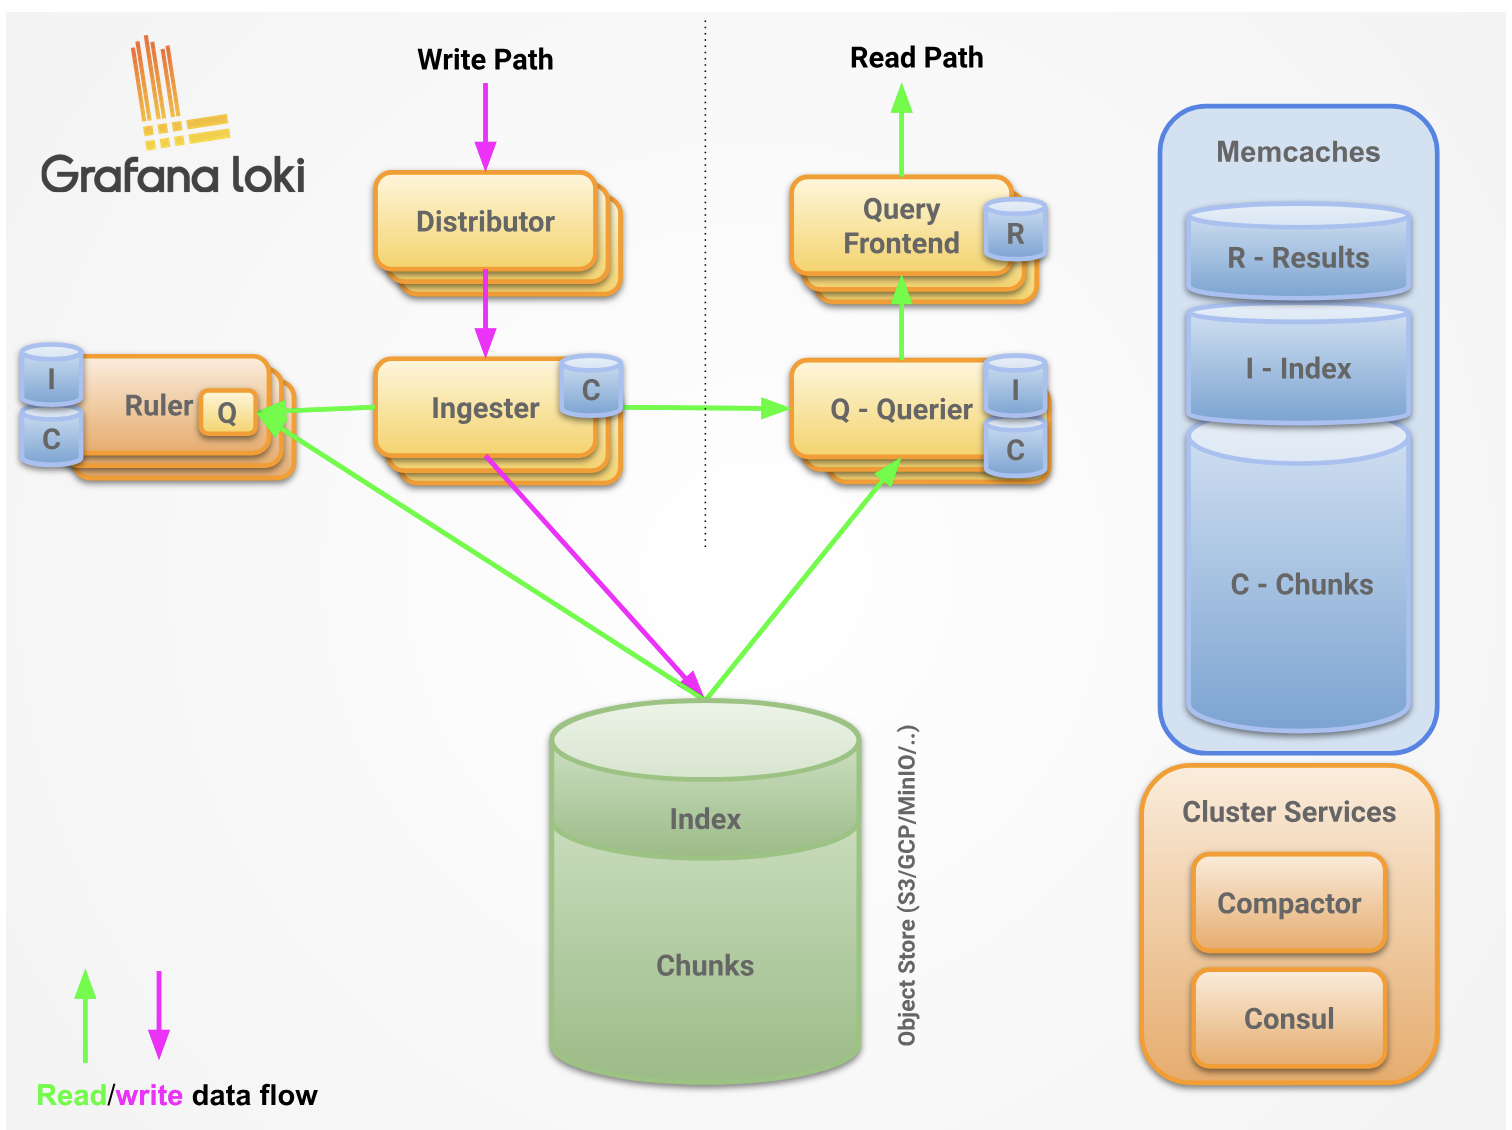
Loki is a horizontally scalable logging system composed of multiple microservices. It supports various remote storage backends such as S3, Azure Blob Storage, and GCS to store logs.
Loki separates log data into two components:
- Index: Contains labels and timestamp pointers (stored in TSDB format)
- Chunks: Compressed blocks of actual log content (stored in object storage)
The index is stored in a special format called TSDB, which is more efficient and faster than the older boltdb-shipper format. This separation allows Loki to keep the frequently-accessed index fast and small while storing large volumes of log data efficiently in cheap object storage.
Components Deep Dive
Write Path Components
Distributor
- Receives log streams via HTTP POST (
/loki/api/v1/push) - Validates log entries and rate limits
- Hashes each stream and distributes to appropriate ingesters via consistent hash ring
- Handles replication by sending to multiple ingesters based on replication factor
Ingester
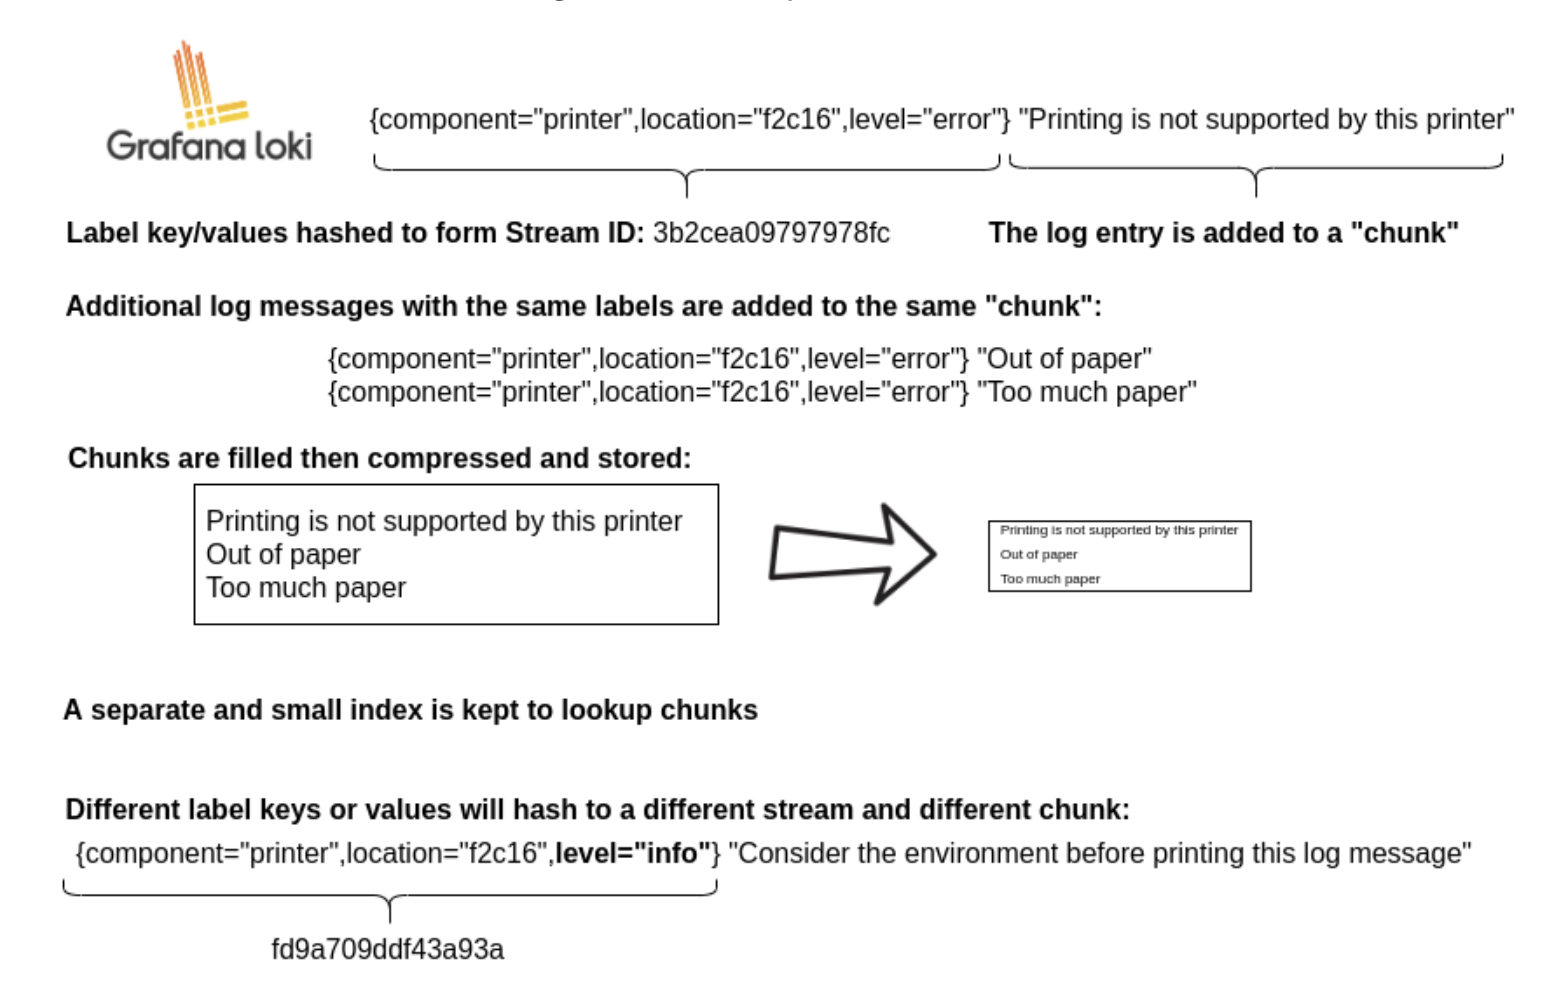
- Buffers incoming logs in memory
- Builds compressed chunks for each unique stream (label set combination)
- Each chunk is unique per tenant and label set
- Flushes completed chunks to long-term storage periodically
- Participates in consistent hash ring for scalability
- Replication factor ensures data durability
Read Path Components
Query Frontend (optional)
- Receives LogQL queries from clients
- Splits large queries into smaller sub-queries by time range
- Caches query results to improve performance
- Provides query queueing and fairness
Query Scheduler (optional)
- Provides centralized queue between query frontend and queriers
- Improves resource utilization across queriers
- Prevents querier overload
Querier
- Executes LogQL queries
- Fetches recent data from ingesters (in-memory)
- Retrieves historical data from storage backend
- Merges and deduplicates results
- Returns combined results to query frontend
Background Components
Index Gateway
- Serves index data from object storage (especially with TSDB)
- Reduces duplicate index fetching across queriers
- Improves query efficiency at scale
Compactor
- Merges small index files into larger ones
- Applies retention policies and deletes old data
- Keeps storage organized and queries performant
- Runs continuously in the background
Ruler
- Evaluates log-based alerting and recording rules (LogQL)
- Runs on a schedule
- Sends alerts to Alertmanager or configured destinations
Write Path Details
- Distributor receives HTTP POST with log streams and entries
- Distributor hashes each stream to determine target ingesters using consistent hash ring
- Distributor sends stream to appropriate ingester replicas (based on replication factor, typically 3)
- Ingester creates new chunk or appends to existing chunk for the stream (each chunk is unique per tenant and label set)
- Ingester acknowledges the write
- Distributor waits for quorum of acknowledgments (e.g., 2 out of 3 replicas)
- Distributor returns success (2xx) if quorum achieved, error (4xx/5xx) otherwise
Read Path Details
- Query frontend receives HTTP GET with LogQL query
- Query frontend splits query into time-based sub-queries
- Query frontend passes sub-queries to query scheduler
- Querier pulls sub-queries from scheduler queue
- Querier queries all ingesters for in-memory data
- Ingesters return matching in-memory data if available
- Querier lazily loads historical data from storage if needed
- Querier deduplicates results and returns to query frontend
- Query frontend waits for all sub-queries to complete
- Query frontend merges individual results and returns final result to client
Deployment Modes
Monolithic Mode
The entire Loki stack runs as a single binary/process. Simplest to deploy but hard to scale independently.
Use for: Development, testing, small deployments (<100GB/day)
Microservices Mode
Each component (distributor, ingester, querier, etc.) deploys independently. Maximum flexibility and scalability.
Use for: Large production deployments (>500GB/day), fine-grained scaling needs
Simple Scalable Mode (Recommended)
Middle ground between monolithic and microservices. Components are grouped into three scalable units:
- Write: Distributor + Ingester (handles log ingestion)
- Read: Querier + Query Frontend (handles queries)
- Backend: Compactor + Index Gateway + Query Scheduler + Ruler (background processing)
Use for: Most production deployments (100GB-500GB/day), balanced simplicity and scalability
Note: The UI (e.g., Grafana) and log collection agents (e.g., Promtail) are separate from Loki’s core components and not included in any deployment mode.
Label Design Best Practices
Labels are the most critical aspect of Loki’s design. Poor label choices can severely impact performance and costs.
The Cardinality Problem
Each unique combination of labels creates a new stream. Each stream gets its own index entry and chunks. High cardinality (many unique label combinations) causes:
- Increased memory pressure on ingesters
- Slower queries (must search more streams)
- Higher storage costs for indexes
- Potential ingestion failures
Good Labels
Labels should be:
- Bounded: Limited set of possible values
- Meaningful: Used in queries frequently
- Static or slowly-changing: Environment, service, region
Examples:
environment: dev, staging, production (3 values)service: api, web, worker (bounded by your services)region: us-east-1, eu-west-1, ap-south-1 (bounded by deployment regions)level: debug, info, warn, error (5 values)namespace: monitoring, default, kube-system (bounded by K8s namespaces)
Bad Labels
Labels should NOT be:
- Unbounded: Infinite or near-infinite values
- High cardinality: Thousands or millions of unique values
- Highly dynamic: Changes with every log line
Examples to avoid:
user_id: abc-123, def-456, … (millions of users = millions of streams)request_id: uuid-1, uuid-2, … (unique per request)timestamp: 2024-01-01T10:30:00Z, … (infinite values)ip_address: 192.168.1.1, … (thousands of IPs)session_id: session-xyz, … (unique per session)
Real-World Impact
Bad label scenario:
1
2
3
4
5
# DON'T DO THIS
labels:
  service: api
  user_id: "12345"
  request_id: "abc-xyz-123"
With 1M users and 1000 requests/sec, you’d create 1B+ streams, overwhelming Loki.
Good label scenario:
1
2
3
4
5
6
# DO THIS
labels:
  service: api
  environment: production
  region: us-east-1
# Put user_id and request_id in the log line itself, not labels
With 10 services × 3 environments × 3 regions = 90 streams total, Loki performs optimally.
Deploying to Kubernetes
This deployment uses:
- Kubernetes: v1.28+ (tested on GKE)
- ArgoCD: For GitOps-based deployment
- Helm: Chart version loki:6.46.0, promtail:6.17.1
- Storage: Google Cloud Storage (GCS)
- Mode: Simple Scalable (production-ready)
Prerequisites
- Kubernetes cluster with ArgoCD installed
- GCS buckets created:
my-chunks: Stores log chunks (Standard storage class, us-central1)my-ruler: Stores ruler data (Standard storage class)my-admin: Stores admin data (Standard storage class)
- GCP Service Account with permissions:
storage.objects.createstorage.objects.deletestorage.objects.getstorage.objects.list
- Service account key downloaded
Step 1: Create Kubernetes Secret
1
2
3
4
5
6
7
8
9
10
# Create namespace
kubectl create namespace monitoring

# Create secret from GCS service account key
kubectl create secret generic loki-gcs-key \
  --from-file=gcs-key.json=/path/to/service-account-key.json \
  -n monitoring

# Verify secret
kubectl get secret loki-gcs-key -n monitoring
Step 2: Deploy Loki via ArgoCD
Configure ArgoCD application pointing to Grafana’s Helm chart repository:
- Repository: https://grafana.github.io/helm-charts
- Chart: loki
- Version: 6.46.0
- Namespace: monitoring
Loki Helm Values
1
2
3
4
5
6
7
8
9
10
11
12
13
14
15
16
17
18
19
20
21
22
23
24
25
26
27
28
29
30
31
32
33
34
35
36
37
38
39
40
41
42
43
44
45
46
47
48
49
50
51
52
53
54
55
56
57
58
59
60
61
62
63
64
65
66
67
68
69
70
71
72
73
74
75
76
77
78
79
80
81
82
83
84
85
86
87
88
89
90
91
92
93
94
95
96
97
98
99
100
101
102
103
104
105
106
107
108
109
110
111
112
113
114
115
116
117
118
119
120
121
122
123
124
125
126
127
128
129
130
131
132
133
134
135
136
137
138
139
140
141
142
143
144
145
146
147
148
149
150
151
152
loki:
  # Use TSDB index format (faster than old boltdb-shipper)
  schemaConfig:
    configs:
      - from: "2024-04-01"
        store: tsdb
        object_store: gcs
        schema: v13
        index:
          prefix: loki_index_
          period: 24h  # New index file every 24 hours

  server:
    # Allow long-running connections for streaming queries
    http_server_read_timeout: 600s

  storage_config:
    gcs:
      bucket_name: my-chunks

  # Use snappy compression for good balance of speed and size
  ingester:
    chunk_encoding: snappy

  # Enable pattern detection for structured logging insights
  pattern_ingester:
    enabled: true

  limits_config:
    allow_structured_metadata: true  # Support structured metadata extraction
    volume_enabled: true              # Enable volume insights in Grafana
    retention_period: 672h            # 28 days retention (4 weeks)
    query_timeout: 5m                 # Prevent runaway queries

  # Enable automatic deletion of old logs
  compactor:
    retention_enabled: true
    delete_request_store: gcs

  # Configure alerting rules
  ruler:
    enable_api: true
    storage:
      type: gcs
      gcs:
        bucket_name: my-ruler

  # Limit concurrent queries per querier to prevent overload
  querier:
    max_concurrent: 4

  # Storage backend configuration
  storage:
    type: gcs
    bucketNames:
      chunks: my-chunks
      ruler: my-ruler
      admin: my-admin

  # Disable multi-tenancy (use for single-tenant setups)
  auth_enabled: false

# Deployment mode - Simple Scalable
deploymentMode: SimpleScalable

# Write component - handles log ingestion
# Sized for ~50GB/day ingestion rate
write:
  replicas: 3  # 3 replicas for high availability and quorum writes
  persistence:
    enabled: true
    size: 10Gi  # Persistent storage for WAL and uncommitted chunks
  resources:
    requests:
      cpu: 200m      # Base CPU for steady-state operation
      memory: 512Mi  # Minimum for buffering incoming logs
    limits:
      cpu: 1000m     # Allow bursts during high ingestion
      memory: 1Gi    # Prevent OOM during traffic spikes
  extraVolumes:
    - name: gcs-key-volume
      secret:
        secretName: loki-gcs-key
  extraVolumeMounts:
    - name: gcs-key-volume
      mountPath: /etc/loki/gcs
  extraEnv:
    - name: GOOGLE_APPLICATION_CREDENTIALS
      value: /etc/loki/gcs/gcs-key.json

# Read component - handles queries
# Sized for ~10-20 concurrent queries
read:
  replicas: 2  # 2 replicas for query load balancing
  resources:
    requests:
      cpu: 200m
      memory: 512Mi
    limits:
      cpu: 1000m     # Allow bursts for complex queries
      memory: 1Gi

# Backend component - handles compaction, indexing, and rules
# Sized for background processing workload
backend:
  replicas: 1  # Single replica sufficient for background tasks
  persistence:
    enabled: true
    size: 10Gi  # Storage for compaction temporary files
  resources:
    requests:
      cpu: 200m
      memory: 512Mi
    limits:
      cpu: 1000m
      memory: 1Gi
  extraVolumes:
    - name: gcs-key-volume
      secret:
        secretName: loki-gcs-key
  extraVolumeMounts:
    - name: gcs-key-volume
      mountPath: /etc/loki/gcs
  extraEnv:
    - name: GOOGLE_APPLICATION_CREDENTIALS
      value: /etc/loki/gcs/gcs-key.json

# Gateway (NGINX) - single entry point for all Loki traffic
gateway:
  enabled: true
  replicas: 1
  service:
    type: ClusterIP  # Use LoadBalancer for external access
  resources:
    requests:
      cpu: 50m
      memory: 128Mi
    limits:
      cpu: 200m
      memory: 256Mi

# Disable components not used in SimpleScalable mode
singleBinary:
  replicas: 0

# Disable built-in MinIO (we're using GCS)
minio:
  enabled: false

# Disable results cache (can enable for better query performance)
chunksCache:
  enabled: false
Configuration highlights:
- TSDB Index: Using Loki’s newer TSDB format for better performance and reliability compared to the older boltdb-shipper
- Retention: 28 days retention enforced by compactor, suitable for development/staging (adjust to 90+ days for production)
- Structured Metadata: Enabled for richer querying and log parsing capabilities
- Simple Scalable: Independent scaling of write (ingestion), read (queries), and backend (compaction) components
- GCS Security: Service account credentials mounted only into pods that need storage access (write and backend components)
Step 3: Deploy Promtail via ArgoCD
Configure ArgoCD application:
- Repository: https://grafana.github.io/helm-charts
- Chart: promtail
- Version: 6.17.1
- Namespace: monitoring
Promtail Helm Values
1
2
3
4
5
6
7
8
9
10
11
12
13
14
15
16
17
18
19
20
21
22
23
24
25
26
27
28
29
30
31
32
33
34
35
36
37
38
39
40
41
42
43
44
45
46
47
48
49
50
51
52
53
54
55
56
57
58
59
60
61
62
63
64
65
66
67
68
69
70
config:
  # Loki push endpoint (gateway service)
  clients:
    - url: http://loki-gateway.monitoring.svc.cluster.local/loki/api/v1/push

  # Track file positions to avoid re-reading logs after restart
  positions:
    filename: /run/promtail/positions.yaml

  # Pipeline stages for log processing
  snippets:
    pipelineStages:
      - cri: {}  # Parse CRI (Container Runtime Interface) format
      - labeldrop:
          - filename  # Drop to reduce cardinality (high-cardinality label)
          - stream    # Drop to reduce cardinality (stdout/stderr only)

# Deploy as DaemonSet to run on every node
daemonset:
  enabled: true

# Resource limits per Promtail pod
resources:
  requests:
    cpu: 100m      # Low CPU for log tailing
    memory: 128Mi  # Minimal memory for buffering
  limits:
    cpu: 200m
    memory: 256Mi

# Optional: Deploy only to specific node pools
# nodeSelector:
#   cloud.google.com/gke-nodepool: production

# Optional: Allow scheduling on tainted nodes
tolerations: []
#  - key: "workload-type"
#    operator: "Equal"
#    value: "production"
#    effect: "NoSchedule"

# Enable Prometheus metrics scraping
serviceMonitor:
  enabled: true

# Mount host directories to read container logs
defaultVolumes:
  - name: pods
    hostPath:
      path: /var/log/pods
  - name: containers
    hostPath:
      path: /var/lib/docker/containers

defaultVolumeMounts:
  - name: pods
    mountPath: /var/log/pods
    readOnly: true
  - name: containers
    mountPath: /var/lib/docker/containers
    readOnly: true

# Persistent position tracking
extraVolumes:
  - name: positions
    emptyDir: {}

extraVolumeMounts:
  - name: positions
    mountPath: /run/promtail
Configuration highlights:
- Client URL: Points to Loki gateway service within the cluster
- Position Tracking: Maintains cursor position in log files to avoid duplicate ingestion after restarts
- Log Sources: Monitors
/var/log/pods(Kubernetes logs) and/var/lib/docker/containers(Docker container logs) - Cardinality Control: Drops
filenameandstreamlabels to prevent cardinality explosion - DaemonSet: Ensures every node runs a Promtail pod to collect all container logs
Step 4: Verify Deployment
1
2
3
4
5
6
7
8
9
10
11
12
13
14
# Check Loki pods
kubectl get pods -n monitoring -l app.kubernetes.io/name=loki

# Check Promtail pods (should be one per node)
kubectl get pods -n monitoring -l app.kubernetes.io/name=promtail

# Check Loki gateway service
kubectl get svc -n monitoring loki-gateway

# View Loki logs
kubectl logs -n monitoring -l app.kubernetes.io/component=write --tail=100

# Test log ingestion
kubectl logs -n monitoring -l app.kubernetes.io/name=promtail --tail=50